Welcome to Matrix Education
To ensure we are showing you the most relevant content, please select your location below.
Select a year to see courses
Select a year to see available courses

The High School rankings guide provides an understanding of how different schools perform in relation to each other.
These rankings provide an indication of students’ success rate of achieving Band 6 at a school.
You can find high school ranking data from 2010 onwards in this guide. Read the 2025 HSC results here.
The High School rankings have been compiled using data published by NSW Education Standards Authority (NESA) each year.
The rankings are calculated using the ratio of the number of Band 6 results to the number of exams sat by the school.
To calculate this ratio (referred to Success Rate) for each school, NESA uses the following information:
Here’s an explanation of the terms used in the High School ranking tables.
This is the total number of HSC courses sat that receive an HSC mark at a school. This does not refer to the number of students, but quite literally refers to the number of individual courses and exams sat by the Year 12 cohort of the school. As an example, let’s look at some data from the 2024 High School Rankings:
| Data from the 2025 High School Rankings | ||||||
| School | 2025 Ranking | 2024 Ranking | 2023 Ranking | 2025 Success Rate | High Scores | 2025 Total HSC Exam Sat |
| North Sydney Boys High School | 1 | 1 | 1 | 71.6% | 663 | 926 |
| James Ruse Agricultural High School | 2 | 2 | 2 | 70.43% | 705 | 1001 |
In this example, North Sydney Boys High School had 926 HSC exams sat and James Ruse Agricultural High School had 1001 HSC exams sat.
High Scores – formerly called “Total Credits” – refers to the number of Band 6 results that students from that school achieved. Let’s see what this means for the results by looking again at the 2025 High School Rankings:
| Data from the 2025 High School Rankings | ||||||
| School | 2025 Ranking | 2024 Ranking | 2023 Ranking | 2025 Success Rate | High Scores | 2025 Total HSC Exam Sat |
| North Sydney Boys High School | 1 | 1 | 1 | 71.6% | 663 | 926 |
| James Ruse Agricultural High School | 2 | 2 | 2 | 70.43% | 705 | 1001 |
In the table above, North Sydney Boys High School had 663 Band 6 results out of the 926 HSC exams sat. James Ruse Agricultural High School had 705 Band 6 results out of the 1001 HSC exams sat. This information is then used to calculate the Success Rate of the School.
Success Rate is a percentage calculated from a ratio of the number of Band 6 results a school achieved to the total number of HSC exams the school sat.
Here are the 2025 results to figure this out:
| Data from the 2025 High School Rankings | ||||||
| School | 2025 Ranking | 2024 Ranking | 2023 Ranking | 2025 Success Rate | High Scores | 2025 Total HSC Exam Sat |
| North Sydney Boys High School | 1 | 1 | 1 | 71.6% | 663 | 926 |
| James Ruse Agricultural High School | 2 | 2 | 2 | 70.43% | 705 | 1001 |
If we take the number of Band 6 High Scores from the school and then divide this by the number of total exams sat we can get a success rate for the school. This can be used to learn the percentage of Band 6 results in each cohort.
Looking at North Sydney Boys High School, for example,
\( \frac{663 \ {\text{High Scores}}}{926 \ {\text {Total Exam Sat}}} = .7159 =71.6%\)This means that North Sydney Boys High School had a success rate of 71.6%.
In contrast, James Ruse Agricultural High School had a success rate of 70.43% even though it had a higher number of Band 6 results (41 more than North Sydney Boys High School). This is because James Ruse had a higher number of total exams sat and therefore lowered their success rate.
The final category is the Previous Ranking. This allows you to see how much a school’s position has changed in relation to others, if it has changed at all.
Let’s take another look at the table:
| Data from the 2025 High School Rankings | ||||||
| School | 2025 Ranking | 2024 Ranking | 2023 Ranking | 2025 Success Rate | High Scores | 2025 Total HSC Exam Sat |
| North Sydney Boys High School | 1 | 1 | 1 | 71.6% | 663 | 926 |
| James Ruse Agricultural High School | 2 | 2 | 2 | 70.43% | 705 | 1001 |
Here, we can see that North Sydney Boys High School has been the number 1 ranked school for three years. This means that North Sydney Boys High School is performing consistently.
High School Rankings can be used to predict the likely performance of a school in the following year, based upon its historical performance. Theoretically, you can predict a student’s potential results based upon their relative performance at a school that has consistent results.
If a school consistently performs in the top 20 and has a success rate of 50%, parents can assume that if their child is in the top 40% of the cohort they will have a statistical probability of scoring Band 6 results.
Obviously, this is not guaranteed and relies on the student’s performance throughout the year and the rest of their cohort’s performance.
Generally, high performing schools on this guide are selective schools which attract more academically driven students. Many parents use these rankings to select their preferences in their child’s Selective School applications. Admission to selective schools is predominantly based on the selective schools admissions test sat by Primary School students in Year 6 for Year 7 entry.
However, the competitive nature of some schools may not be for all students. For example, a student who struggles at a competitive selective school could flourish and achieve consistent Band 6 results at a non-selective school.
It’s important to be aware that there are other factors other than academic results when making decisions on selecting a high school.
You should use this High School Ranking information to make an informed judgement about schools. You can compare schools’ results to decide where to send your child, or to inform a decision to change schools during High School.
There are two important things to bear in mind when looking through the High School rankings.
The High School Rankings are not real-time information. As this information is collected at the end of the year, it does not take into account changes at a school that may have a significant impact on its results.
Just because a school has performed highly one year does not guarantee it will the following year. However, historical data can allow you to predict the future performance of the school.
For example, if we look at the 2025 results we can see that some schools have had significant fluctuations in the past while others have had consistent results:
| Data from the 2025 High School Rankings | ||||||
| School | 2025 Ranking | 2024 Ranking | 2023 Ranking | 2025 Success Rate | High Scores | 2025 Total HSC Exam Sat |
| North Sydney Boys High School | 1 | 1 | 1 | 71.6% | 663 | 926 |
| James Ruse Agricultural High School | 2 | 2 | 2 | 70.43% | 705 | 1001 |
| Sydney Grammar School | 3 | 3 | 7 | 60.99% | 763 | 1251 |
| North Sydney Girls High School | 4 | 8 | 4 | 60.46% | 549 | 908 |
| Normanhurst Boys High School | 5 | 4 | 8 | 57.73% | 433 | 750 |
| Epping Boys High School | 100 | 60 | 80 | 17.72% | 218 | 1230 |
| Mercy Catholic College | 101 | 157 | 128 | 17.67% | 126 | 713 |
In 2025, Normanhurst was ranked 5th. In 2016, it was ranked 11th, and in 2015 it was ranked 25th. Penrith has had consistent improved rankings and because they have a Success Rate of 57.73% students in the top 60% of their cohort will have a statistical likelihood of achieving Band 6 results.
However, parents who had considered and rejected Mercy Catholic College because it had previous results in the 150s and 120s in previous years would have been surprised to see that they’d jumped over 50 spots in the rankings in twelve months. Students leaving in the wake of the poor performance in 2024 would be disappointed to see that it had a similar drastic improvement in marks and they left for no reason.
Meanwhile, Santa Sabina College was ranked 60th in 2024, but in 100th in 2025. That’s a significant change that could have been caused by a number of reasons, such as changes in faculty, staff, or poor cohort performance.
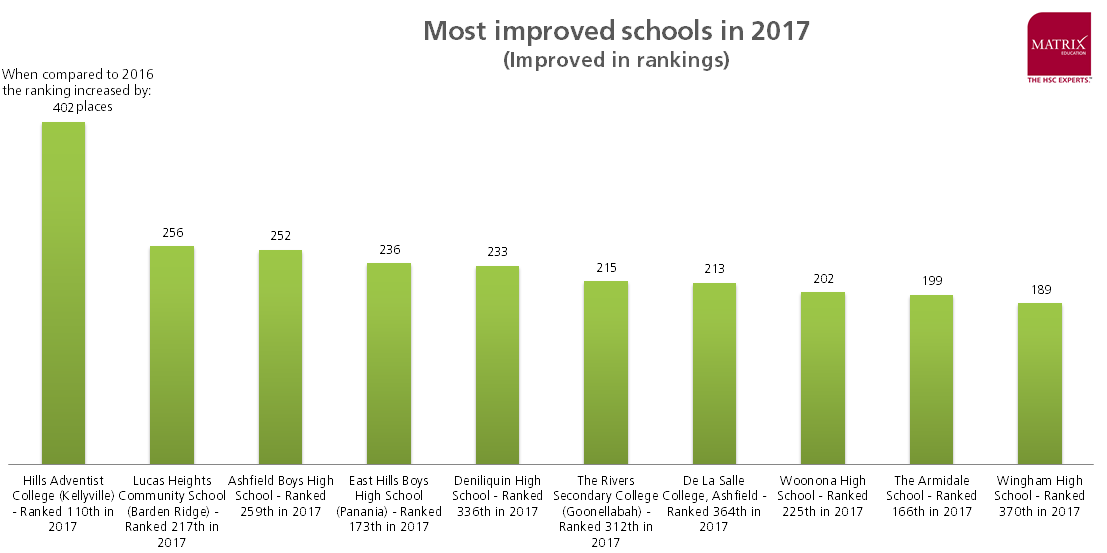
To illustrate how significant the changes can be, consider this graph of the 2017 movers and shakers:
Given that the vast majority of students remain at the same school for their whole school life, past performance can give parents assurances about their child’s potential performance in the future.
But parents should also remember that schools can jump hundreds of places in the High School Rankings in a single year. Your local school could be 1 cohort away from the top 20 or even top 10 schools.
High School Rankings provide relative information and caution should be exercised considering a school’s success without it being in relation to other schools.
In addition, Success Rate alone is an inaccurate measure of a school’s successes and failures.
To illustrate this, let’s look at the 2017 table again:
| Data from the 2025 High School Rankings | ||||||
| School | 2025 Ranking | 2024 Ranking | 2023 Ranking | 2025 Success Rate | High Scores | 2025 Total HSC Exam Sat |
| North Sydney Boys High School | 1 | 1 | 1 | 71.6% | 663 | 926 |
| James Ruse Agricultural High School | 2 | 2 | 2 | 70.43% | 705 | 1001 |
| … | ||||||
| Kambala | 36 | 12 | 25 | 33.7% | 152 | 451 |
Kambala has 152 Band 6 results, which when you take into account that there were only 451 HSC exams sat by students (potentially only 72 students), that result seems great!
Choosing a school is a complex and challenging process with lots of variables.
Decisions should be based on the data from several years alongside other criteria.
Here are some other criteria to consider when choosing a high school:
A rounded education includes more than a school’s Success Rate or rank.
For example, sending your child to North Sydney Boys High School because it is number one when you live in Baulkham Hills may leave your child exhausted from travel and could be counter-productive for their HSC success.
Similarly, if your child has sporting abilities or aspirations, sending them to a selective school that doesn’t cater strongly to sports is not going to be in their interests.
When choosing a High School you should have an in-depth conversation with your child and research prospective schools in detail. You may want to tour the school and meet some of the staff before making a decision.
Our Matrix courses start in October of each year to help your child stay one step ahead of your peers. Learn more about our Year 3 – 6 and Year 7 – 12 courses, or book a free trial below!
© Matrix Education and www.matrix.edu.au, 2025. Unauthorised use and/or duplication of this material without express and written permission from this site’s author and/or owner is strictly prohibited. Excerpts and links may be used, provided that full and clear credit is given to Matrix Education and www.matrix.edu.au with appropriate and specific direction to the original content.