Welcome to Matrix Education
To ensure we are showing you the most relevant content, please select your location below.
Select a year to see courses
Learn online or on-campus during the term or school holidays
Learn online or on-campus during the term or school holidays
Learn online or on-campus during the term or school holidays
Learn online or on-campus during the term or school holidays
Learn online or on-campus during the term or school holidays
Learn online or on-campus during the term or school holidays
Learn online or on-campus during the term or school holidays
Get HSC Trial exam ready in just a week
Get HSC exam ready in just a week
Select a year to see available courses
Science guides to help you get ahead
Science guides to help you get ahead
Do you want to learn about the NAPLAN report. We explain what your child's NAPLAN report means, what NAPLAN bands are, and how to use these resources to help your child improve.

Join 75,893 students who already have a head start.
"*" indicates required fields

Join 8000+ students each term who already have a head start on their school academic journey.
Is your child undertaking NAPLAN this year? Are you confused about what it is? Are you unsure what the NAPLAN Bands mean? In this article, we’re going to provide you with a breakdown of NAPLAN and what the Bands mean for each NAPLAN test.
In this article on NAPLAN results and bands we’ll discuss:

Done! Your download has been emailed.
Please allow a few minutes for it to land in your inbox.

We take your privacy seriously. T&Cs and Privacy Policy.
The National Assessment Program – Literacy of Numeracy is an annual assessment for all students in Years 3, 5, 7 and 9.
The assessment covers all skills that are deemed essential for every child to successfully progress through their school education and beyond. It is considered a reliable and consistent measure of whether students are meeting the most important educational outcomes.
NAPLAN is used to provide a national report on Australian students’ abilities. Results are reported annually and used to formulate curricula and implement policy for education.
Skills covered by the assessment include reading, writing, spelling, grammar, punctuation and numeracy. You can read more about it here.
The NAPLAN assessment is taken during the second full week of May.
The assessment consists of 4 tests, which are undertaken over the course of 3 days.
This area covers spelling, grammar and punctuation. Assesses literary skills that are considered essential for effective communication. The content of this test is aligned with the Australian English Syllabus.
Students are tested on their ability to write imaginative or persuasive texts effectively. Students are provided with two writing prompts of the same text type – both imaginative or both persuasive. The assessed text type is revealed on the day and students cannot choose their own text type.
Tests the students’ ability to read written English. Students are provided with a magazine containing texts of various writing styles, and then answer questions in a separate booklet. The content of this test is aligned with the Australian English Syllabus.
Students are tested on their proficiency across three content strands:
These areas are assessed using multiple-choice, short answer and fill-in-the-blank style questions.
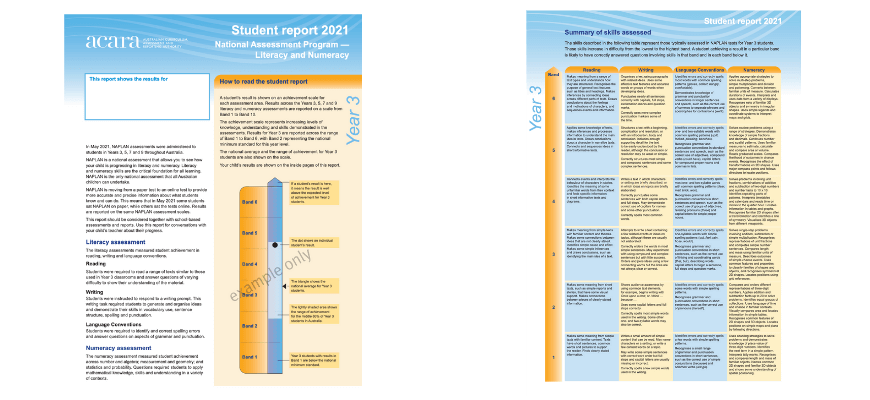
The NAPLAN student report will consist of two documents, the individual student report and the additional student report. Let’s take a look at the individual student report first.
Learn with Matrix+ Online
Expert teachers, comprehensive resources and 1-to-1 help. Build your child's skills for English, Maths and the OC test, wherever you are.
Parents often ask, “How do I read a NAPLAN report?” What we’ll do now is consider the NAPLAN assessment scale.
The individual student report will have two important visual elements that you should familiarise yourself with: the scale and the performance standard.
The scales are the five blue vertical columns that you can see in the diagram below:
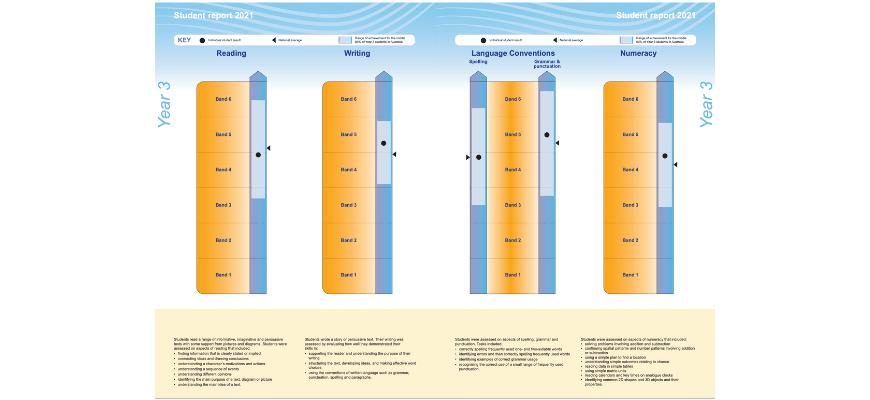
The scales represent the tests your child has undertaken during the week. There is one scale each for reading, writing and numeracy. Two scales are used for language conventions (one scale for spelling, and the other for grammar and punctuation).
According to ACARA, bands – sometimes referred to as the NAPLAN scale – are a range of scores and do not represent a certain point. The student’s raw score within the five domains is used as scaled scores ranging from 0 to 1000. This range of scores forms the numeric scale from which the ten total bands are created. The reports show bands to illustrate the performance of students and relative performance compared to other indicators – the school or the national average.
Each test scale is divided into ten bands.
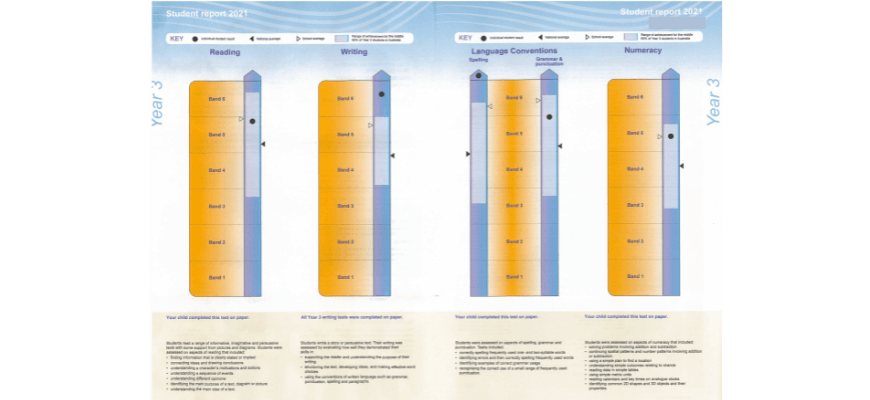
But hold on! You can only see six bands in the image above. Why is that?
Well, while there are ten total bands, only six of the bands are used to measure student performance at each year level:
Why does the range of bands change with each year? Well, the increase in band range reflects the increasing difficulty of the tests as students grow older and develop intellectually. This is considered to be a proficiency scale.
The national minimum standard is represented by the second-lowest band within each year group. So for Year 3, the national minimum standard would be 2, whereas the national minimum standard for Year 5 would be 4.
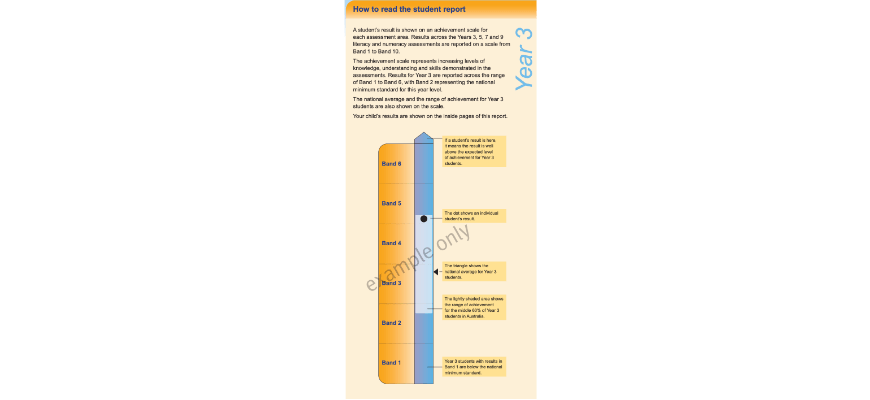
On top of each of the bands, you will notice a pyramid. These represent when a child has scored above the Band expectations. It is rare for students to perform this highly. It suggests that in that area, students are performing at a level higher than the grade.
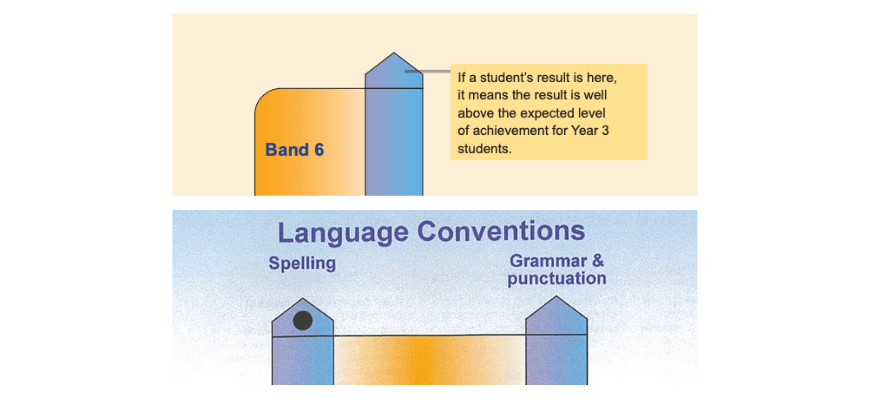
Knowing this, we can now address the icons displayed on the scales.
Using the Key provided alongside the scales, we can see that the large black dot represents the individual student result. This shows how well your child performed in that particular test.
The black triangle represents the national average. The unfilled triangle represents the school average. Finally, the light blue subsection you can see along each blue scale represents the range of achievements for the middle 60% of all Australian students in your child’s year. If these are all aligned, it represents the same level of performance in that area between the student, school, and national average.
By comparing the black dot (your child’s individual performance) with these other elements, you can form a picture of how they performed relative to their school and the nation as a whole.
For example, in the above diagram, we can see that for Reading and Numeracy, the student performed at their school average and above the national average. Their performance was in line with the middle 60% of all Australian students. The student was able to meet the minimum national standard. However, they were not performing to the same level as their stronger subjects.
While the child’s performance in writing and, especially spelling, was good, reading and numeracy should still be a point of concern for the parent. they should use this information to prioritise reading and maths in their child’s education.
The additional student report provides information regarding how your child responded to specific questions. This report consists of tables for each test. The questions are ordered according to difficulty. The column on the left represents the questions that the student correctly answered, whereas the column on the right side represents the questions that the student had done incorrectly or did not attempt.
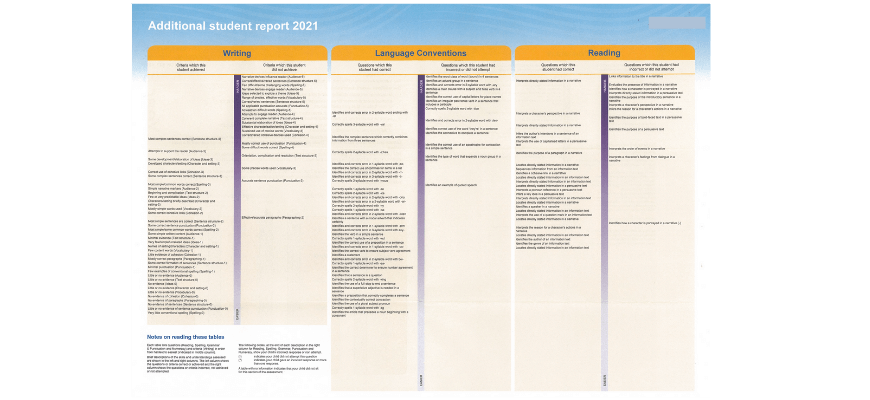
The dark line through the middle of both columns represents the range of difficulty of the questions, with questions towards the tops being more difficult, while questions near the bottom being easier. A typical spread will have most of the incorrect answers being near the top, and most of the correctly answered questions being closer to the bottom.
These two documents can be used in conjunction with one another in order to obtain a more holistic image of your child’s performance.
First, look at the questions that your child has gotten incorrect and think to yourself: are there any patterns or similarities with their incorrect answers?
For example:
By identifying patterns, you will be able to target your child’s weaknesses far more effectively and efficiently.
Second, once you have identified where your child is struggling. Have an honest discussion with them. Ask what they find difficult: Do they struggle with a particular type of question? Are they afraid to ask questions or ask for help in class? Would they like additional support?
Finally, once you’ve found the weaknesses and discussed the reasons for the child’s difficulty, it is time to plan to improve!
Improvement requires consistent practice and revision. A good initial plan is to simply develop a study plan for NAPLAN topics. use a planner or calendar to set aside time in your child’s schedule each week for these subjects.
To ensure their weaknesses are supported, weight the time more towards the weaker areas until they improve. Remember, don’t neglect the already successful areas. Learning is like any skill: if you don’t use it, you’ll lose it!
If you’re after more Primary School and NAPLAN resources and advice, you should check out our other articles. We are always adding new articles to support our community of students and parents:
And we have these download resources to support parents and students:
Written by Matrix Education
Matrix is Sydney's No.1 High School Tuition provider. Come read our blog regularly for study hacks, subject breakdowns, and all the other academic insights you need.© Matrix Education and www.matrix.edu.au, 2025. Unauthorised use and/or duplication of this material without express and written permission from this site’s author and/or owner is strictly prohibited. Excerpts and links may be used, provided that full and clear credit is given to Matrix Education and www.matrix.edu.au with appropriate and specific direction to the original content.