Welcome to Matrix Education
To ensure we are showing you the most relevant content, please select your location below.
Select a year to see courses
Select a year to see available courses

In Part 2 of the Physics Practical Skills Guide, we looked at reliability, accuracy and validity and how they are affected by different types of errors. In this part of the Physics Practical Skills Guide, we look at experimental errors (systematic and random errors) in more detail.
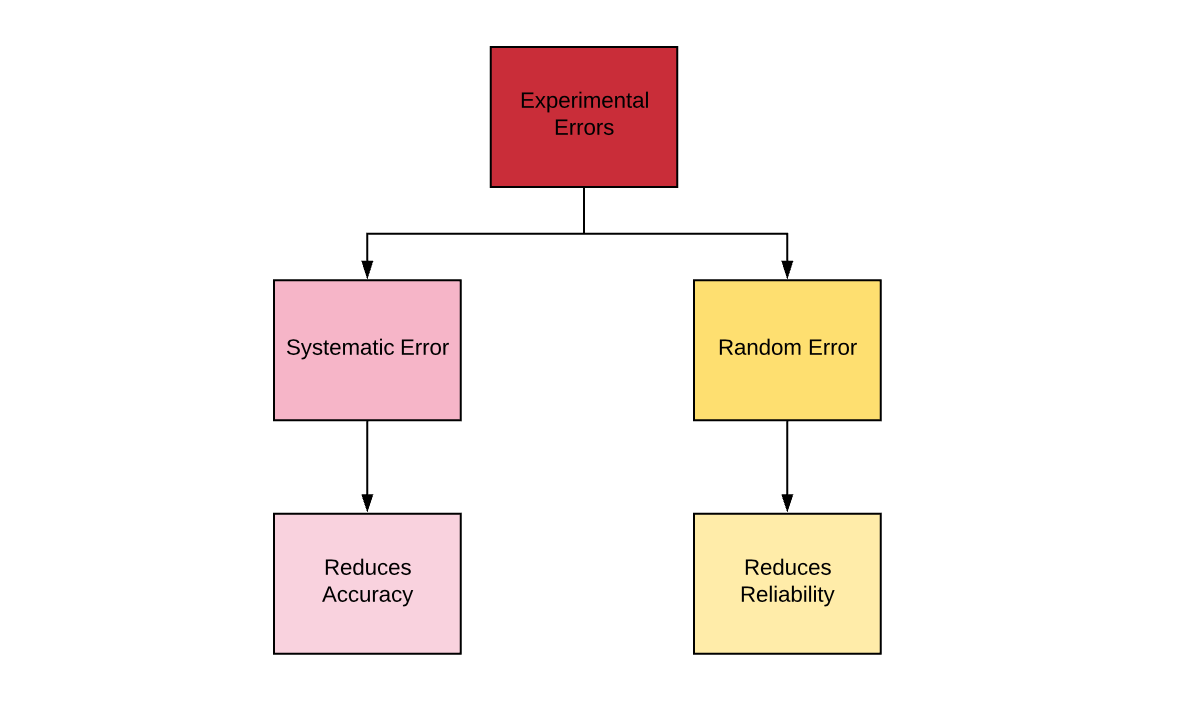
There are two types of experimental error:
Systematic errors affect accuracy whereas random errors affect the reliability of experimental results.
Learn how to:
with the Matrix Practical Skills Workbook.
Get exam-ready for your Physics practical assessments with this FREE practical skills workbook. 
Sharpen your Physics skills
Systematic errors will shift measurements from their true value by the same amount or fraction and in the same direction all the time. These do not affect the reliability (since they’re always the same) but affect accuracy. These usually arise from problematic or incorrectly used equipment, e.g. poor calibration.
Random errors will shift each measurement from its true value by a random amount and in a random direction. These will affect reliability (since they’re random) but may not affect the overall accuracy of a result.
Different types of errors and their origin are listed below. Each one can be described as a random or a systematic error.
| Error | Description | Systematic or Random error |
| Scale error | If a piece of equipment is not calibrated correctly (e.g. a wooden ruler has shrunk), all measurements will be offset by the same fraction. | Systematic error |
| Zero error | If a piece of equipment has an offset (e.g. a mass balance shows a reading that is not zero when there is nothing on it), all measurements will be offset by the same amount. | Systematic error |
| Parallax error | If you make a measurement by comparing an indicator against a scale (e.g. reading a dial on a voltmeter, or using a mercury thermometer), the angle at which you view it will affect the reading. | Systematic error if you always view the dial from the same angle. Random error if you view the dial from a random angle each time. |
| Errors arising from the environment | Ideally, the control variables are kept constant, but some may be beyond your control, e.g. air pressure, temperature, humidity, vibrations. | Changes to the control variables can result in both systematic and random errors. One consistent change will give a systematic error. Random changes will give random errors. |
| Reaction time | If a measurement relies on your reaction time, then you may react too early or too late by different amounts of time. | Random error. |
| Measurement errors from insufficient precision | If you’re measuring something that falls between two markings on a scale (e.g. you’re using a ruler to measure something that’s 10.25 mm long), you cannot measure its precise value and will need to round it up or down (does it look like 10 mm or 10.5 mm?). | Random error. |
“Human error” is not a source of experimental error. You must classify specific errors as random or systematic and identify the source of the error.
Human error cannot be stated as experimental error.
Percentage errors express an uncertainty or discrepancy in a value as a percentage of the value.
An uncertainty describes the range of values a result or measurement can take, and is related to reliability or precision. If a value is given as x ± 5%, then the value may be larger or smaller by 5%.
A discrepancy is related to the difference between the final result of the experiment and the accepted value, and hence is related to accuracy.
Systematic error arises from equipment, so the most direct way to eliminate it is to use calibrated equipment, and eliminate any zero or parallax errors.
Even if your measurements are affected, some systematic errors can be eliminated in the data analysis. In the analysis we typically draw a graph that gives a straight line, we draw the line of best fit and measure its gradient. By measuring the gradient we are looking at changes only, not absolute values. Zero errors would result in shifting the line up and down (i.e. to the y-intercept of the graph) but will not affect the gradient. Hence, we eliminate zero errors, which increases accuracy.
Since random errors are random and can shift values both higher and lower, they can be eliminated through repetition and averaging. A true random error will average out to zero if enough measurements are taken and averaged (through a line of best fit). This is why repetition of measurements can improve the reliability of the final result of an experiment.
In the analysis, drawing a graph and the line of best fit serves to reduce the random error in the final experimental result. Firstly, outliers can be eliminated. Secondly, the line of best fit is drawn to accommodate as much of the data as possible by cutting in between the set of data points. In this way, the data is averaged, with most weighting given to the most similar values. This reduces the effects of random error and increases reliability.
© Matrix Education and www.matrix.edu.au, 2025. Unauthorised use and/or duplication of this material without express and written permission from this site’s author and/or owner is strictly prohibited. Excerpts and links may be used, provided that full and clear credit is given to Matrix Education and www.matrix.edu.au with appropriate and specific direction to the original content.