Welcome to Matrix Education
To ensure we are showing you the most relevant content, please select your location below.
Select a year to see courses
Select a year to see available courses
Practical exams are an important part of your HSC Physics course as they have a mandatory weighting of 60% of your overall school assessment mark. This means you’ll need to perform well in your practical exams If you want to ace Physics.
Learn how to:
with the Matrix Practical Skills Workbook.
Get exam-ready for your Physics practical assessments with this FREE practical skills workbook. 
Sharpen your Physics skills
Students are often told, “you can’t study for practical exams because they test skills, not knowledge.” This is simply not true!
Students can prepare themselves for a practical assessment, just as for any other assessment.
Below is a process that Physics students at Matrix are taught as part of their preparation for Physics Practical Assessment:
There are two different types of Physics Practical exams you’ll be undertaking in Year 11 and 12. They are:
What’s the difference between First-hand and Second-hand investigations?
In First-hand Investigations, students must carry out an experiment and obtain data themselves. In Second-hand Investigations, the experiment is described and the data provided.
The remainder of the assessment is the same, as summarised in the table below.
| Table: First-hand investigations vs Second-hand Investigations | ||
First-hand Investigation | Second-hand Investigations | |
Experiment | Students are provided with equipment and possibly instructions and must carry out the experiment. | N/A – The experiment may be described in the question. |
Data collection | Students must record data using the equipment provided in the course of the experiment. | N/A – Data is provided, usually in a table. |
Data analysis | Students must analyse the data. Often this involves graphing it so as to produce a straight line graph. The gradient and/or intercept are important. | |
Calculations | Students must use the data (e.g. the gradient from their graph) and relevant equations to address the aim of the experiment (e.g. calculate an unknown). | |
Analysis of method and result | Students must be able to discuss the variables in the experiment, and assess the method and the result in terms of reliability, accuracy and validity, and suggest improvements. | |
Analysis of errors | Students must be able to discuss the errors in the experiment and suggest improvements. | |
Second-hand Investigations regularly appear in exams, particularly the HSC.
The essential scientific skills required for both first-hand and second-hand investigations are listed below:
Your success in the practical exam depends heavily on these scientific skills.
There are many different aspects of practical assessments. So, let’s take a look at some things that can be done to prepare and are important to keep in mind.
First-hand investigations – What experiment?
It’s impossible to predict the experiment in advance, so you should not waste time focusing on that. Instead, you should think through all the possibilities:
The syllabus prescribes some first-hand Investigations that must be completed. In Module 5 Advanced Mechanics, one of the mandatory practical investigations is :
conducting a practical investigation to validate the relationship between the variables:
The experiment may be related to other work you have covered in the theory lessons in class (in the example above, it is related to projectile motion). Consider what experiments you covered in class and what equipment your school has available. Use the information provided in the Practical Assessment Task Notification.
First-hand investigation – Data collection
You will be provided with equipment with which to make measurements.
Consider the dependent and independent variables. Change the independent variable, measure it and record it. Measure the dependent variable and record it.
Record your data using a table like the one below. Note that the independent variable is recorded in the first column of the table.
| Independent variable (x) | Dependent variable (y) | Average Value of Dependent variable (yaverage) |
| Value 1 | Trial 1: Trial 2: Trial 3: Trial 4: Trial 5: | |
| Value 2 | Trial 1: Trial 2: Trial 3: Trial 4: Trial 5: | |
| Value 3 | Trial 1: Trial 2: Trial 3: Trial 4: Trial 5: | |
| Value 4 | Trial 1: Trial 2: Trial 3: Trial 4: Trial 5: | |
| Value 5 | Trial 1: Trial 2: Trial 3: Trial 4: Trial 5: |
Repeat measurements at least three times to improve the reliability of the final result.
Data analysis
The flowchart outlines the process involved with data analysis.
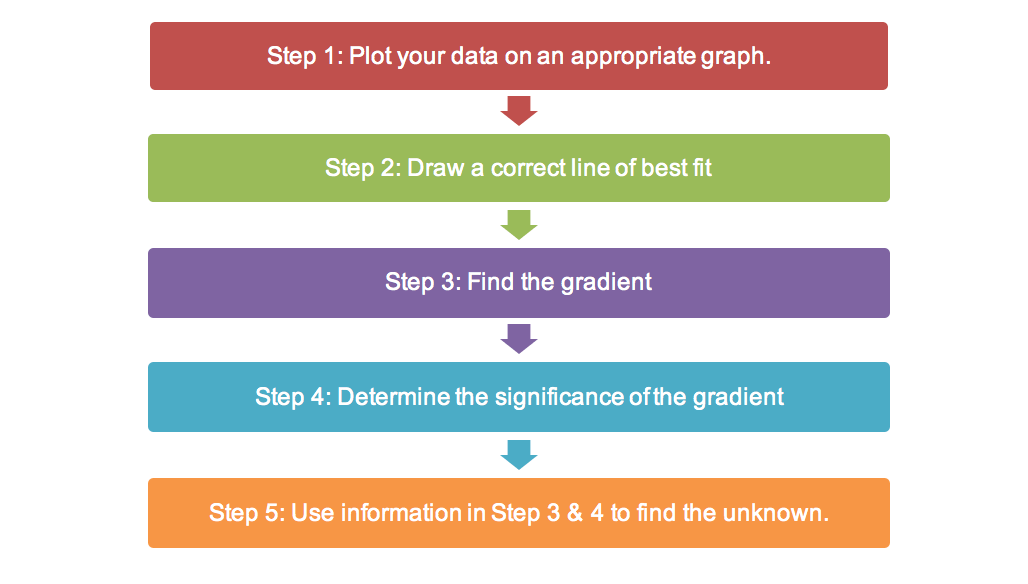
The data analysis starts with drawing a graph including the line of best fit (or far less commonly, a curve).
Sometimes the data needs to be manipulated in order for the graph to produce a straight line so you must understand the underlying governing equations that describe the experiment. This means you must study the theory related to the topic of the experiment.
To apply the theory to the practical assessment you must consider the variables, the relevant equation, and how to apply it. Some additional adjustments may be required: e.g. if the equation gives force, but you measured mass.
For practice, you can go through the equations and consider the dependence of different variables. Make sure you consider how you can produce a straight line for different combinations of variables.
Calculations
Once you have drawn the graph, you will need to consider the equation that represents the graph, and how that compares to the equations you have already studied. Typically, you will need to identify the meaning of the gradient or the intercept and use it to calculate one of the (control) variables in the experiment or one of the physical constants.
Once again, a good understanding of the underlying theory is important.
Analysis of method and errors
You’ll be asked to analyse the experiment in terms of:
You must be able to identify flaws and suggest improvements in reliability, accuracy and validity, and in terms of errors. You can only do this if you have a good understanding of these terms.
Matrix students are taught to use a table like the one below to demonstrate their understanding of how to assess and improve the validity, reliability and accuracy of their experiment.
| Validity | Reliability | Accuracy | |
| Assessment | An experiment is valid if the methods are appropriate, carried out appropriately, and the control variables are kept constant | An experiment is reliable if you get very similar results for every experiment. | An experiment is very accurate if there is a small difference between the experimental results and the accepted true value. |
| Suggestion for improvement | Suggest experimental techniques that will ensure the experiment is valid. | Suggest experimental techniques that will reduce random errors and improve the reliability of the the experiment. | Suggest experimental techniques that will reduce systematic errors and improve the accuracy of the the experiment. |
Finally, practise, practise, practise!
If you know what the experiment will be in advance, you can try and assemble the necessary equipment and practise. If you don’t, then practise anyway on a possible experiment. The important thing is to think through and understand the different aspects of an experiment outlined above. You will then be able to apply them to any experiment.
In Module 5 Advanced Mechanics, you are required to be familiar with the following investigations:
| Topic | Practical Investigation | Examples |
| Projectile Motion | Conduct a practical investigation to validate the relationship between the variables:
|
|
| Circular Motion | Conduct investigations to explain and evaluate, for objects executing uniform circular motion, the relationships that exist between:
| Investigate the relationship between the centripetal force and period using a centripetal mass balance |
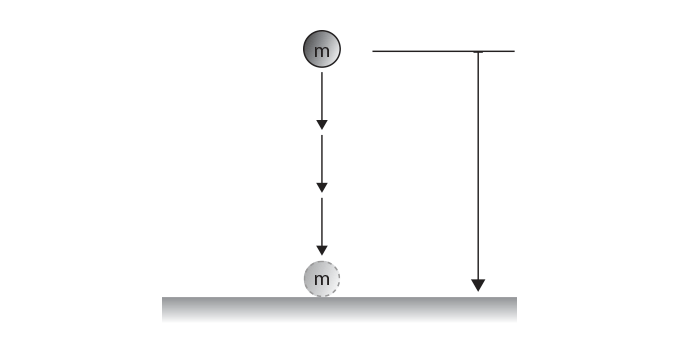
Let’s see how the different aspects of practical skills apply with the first-hand investigation: ‘Dropping a ball from a certain height’.
To measure the acceleration due to gravity g by dropping a ball.
The governing equation for a falling object is given by:
$$s = ut + \frac{1}{2}at^{2}$$
where:
Taking this into account gives:
$$s = \frac{1}{2}gt^{2}$$
We plot the independent variable on the x-axis and the dependent variable on the y-axis. To do this we have to rearrange the equation with the dependent variable being the subject:
$$2s = gt^{2}$$
$$t^{2} = \frac{2s}{g}$$
$$t = \sqrt{ \frac{2s}{g}}$$
If we let \(x = s \) and \(y = t\) then the equation describing the graph would be:
$$y = \sqrt{ \frac{2x}{g}}$$
This is not a straight line, so g will be difficult to determine. Instead, the data must be manipulated to obtain a straight line. But how?
$$t^{2} = \frac{2s}{g}$$
$$y = \frac{2}{g} \times x$$
The independent variable is the height of the ball, and the dependent variable is the time it takes to fall.
One possible method is outlined below:
| Step | Procedure |
| 1 | Using a 1 m wooden ruler, set the height to 0.5 m and drop a ball. |
| 2 | Using a stopwatch record the time taken to fall. Repeat 4 more times. |
| 3 | Increase the height by 50 cm increments for five different height and record the time taken to fall from each height five times. |
| 4 | For each height, average the five time measurements. |
You must also select a good range for the independent variable (height) that makes the dependent variable (time to fall) able to be measured.
Use a table like the one below to document your results.
| Table: Experimental Results for a ball dropped from a certain height. | |||
| height s (m) | Time t (s) | Average Time, taverage (s) | t2 (s2) |
| 0.5 |
| 0.39 | 0.15 |
| 1.0 |
| 0.56 | 0.31 |
| 1.5 |
| 0.66 | 0.44 |
| 2.0 |
| 0.77 | 0.59 |
| 2.5 |
| 0.87 | 0.76 |
To proceed with the analysis of the data, a graph needs to be drawn in order to reduce the effect of errors. To learn how to draw scientific graphs correctly including a line of best fit, read ‘Physics Practical Skills Part 4: Drawing Graphs and Lines of Best Fit‘
Let’s see what you need to consider to draw this graph:
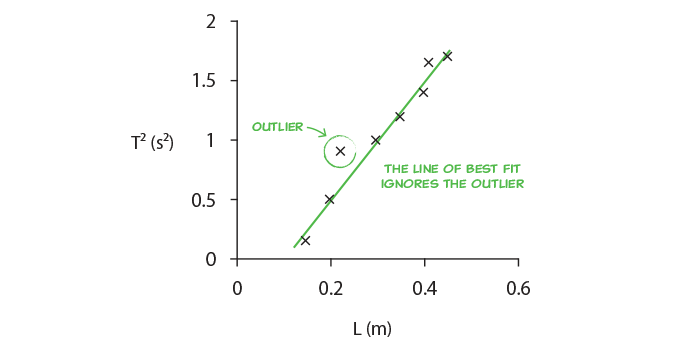
Step 1: Plot t2 vs s and draw a line of best of fit
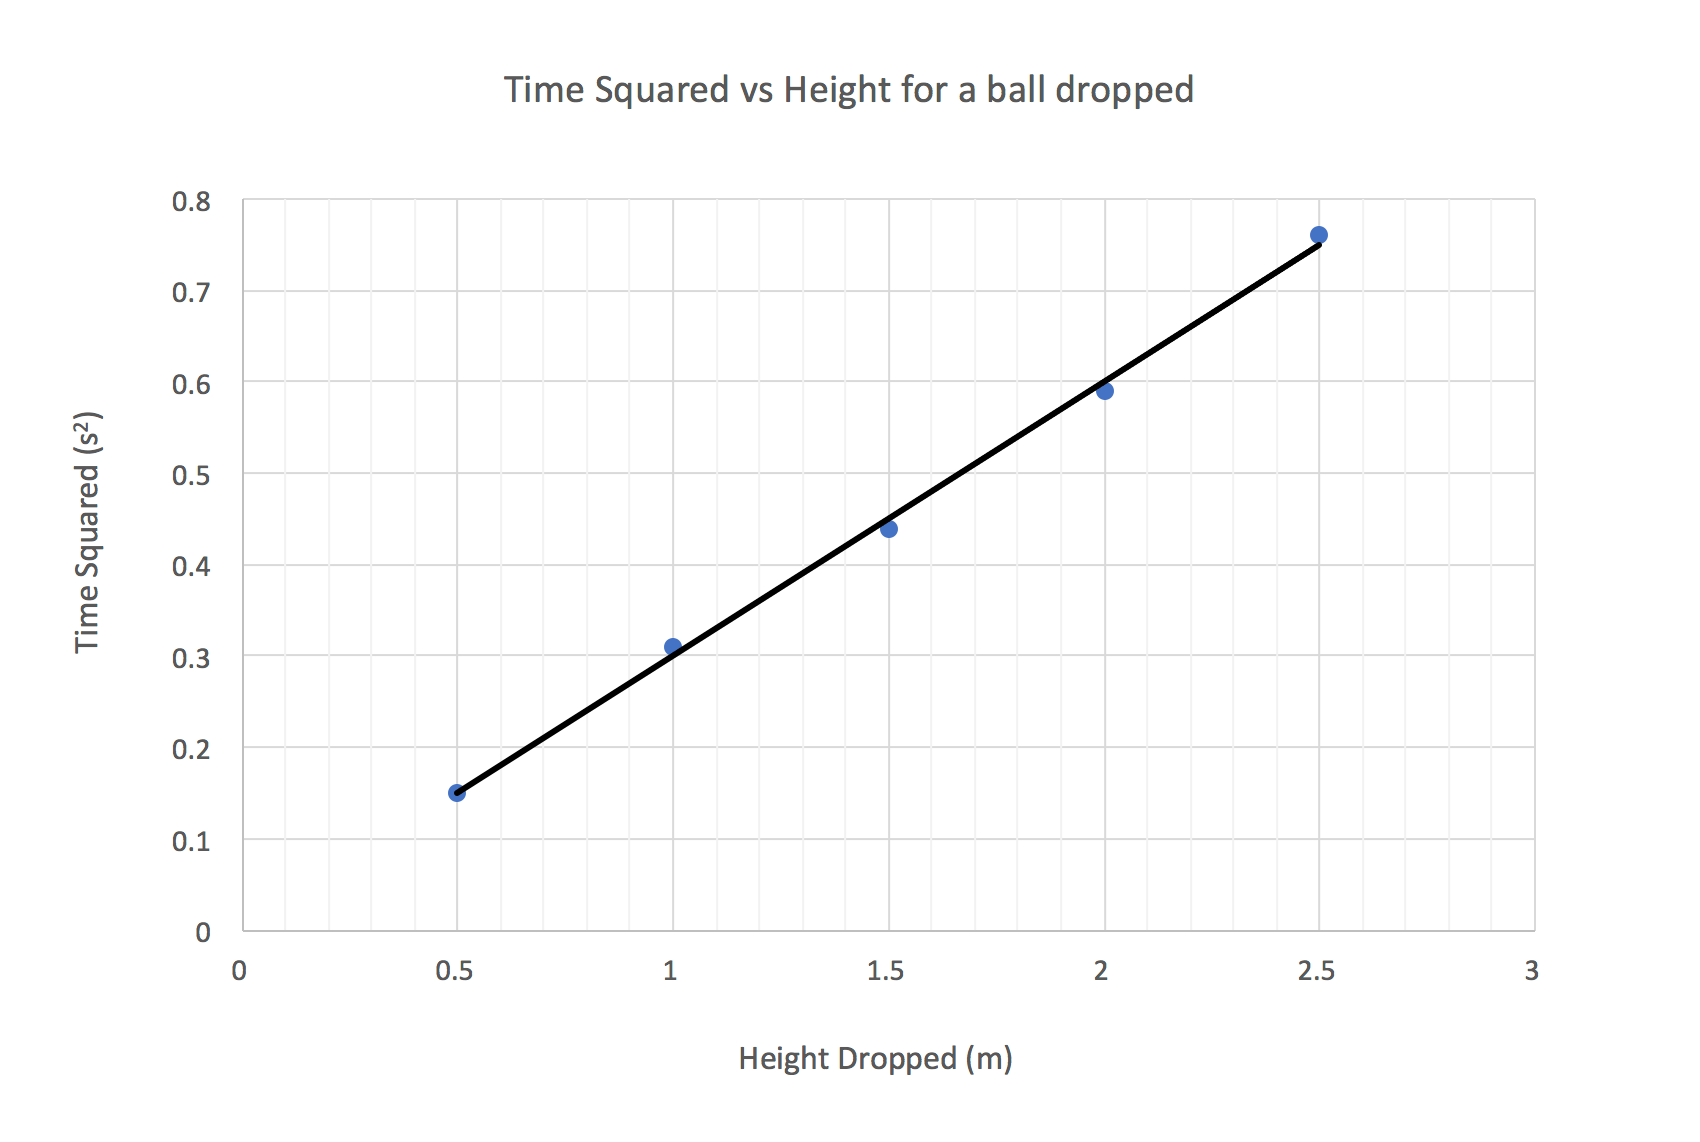
Note that we did not plot t vs s as this would have given a non linear relationship.
The equation describing the graph will be: \(y = \frac{2}{g}x \) as seen above.
Step 2: Determine the expression for the gradient from the equation.
This is a straight line with a gradient of \( \frac{2}{g} \). Hence
$$gradient = \frac{2}{g}$$
Step 3: Measure the gradient of the line of best fit. This will allow you to determine g:
From the graph, the gradient of the line of best is measured to be 0.3
$$g = \frac {2}{gradient}=\frac {2}{0.3}=6.67 \space ms^{-2}$$
Now that you have your value, what can you analyse?
You may need to suggest improvements. For example, a small heavy object will be less affected by air resistance in this experiment. A small metal ball or a marble would be more suitable than a scrunched up piece of paper or a ping-pong ball. While, in contrast, dropping a feather would make the experiment invalid.
The table below assesses the validity, reliability and accuracy of the experiment. It also has suggestions for improvements.
| Validity | Reliability | Accuracy | |
| Assessment | The experiment is valid as the methods were carried out appropriately and the control variables such as the shape and mass of the ball were kept constant. Also the use of a small heavy object minimised the effect of air resistance. | The experiment is reliable as the data points were all very close to the line of best fit. Individual measurements (of time) were not that reliable. | The experiment is not accurate as there is large difference between the experimental result (6.67 m/s2) and the accepted true value (9.8 m/s2) |
| Suggestions for improvements | Use a heavy object that is streamlined to further reduce the effects of air resistance. | Use data logger and sensor to take more reliable measurements of time. Increase the starting height from 0.5 m to 1 m to minimise the percentage of random error in the time measurement. | Use data logger and sensor to take more accurate measurements of time. Calibrate the stop watch. Use a tape measure rather than a wooden ruler. Eliminate/reduce other sources of systematic errors, like air resistance. |
You can learn more about validity, reliability and accuracy in Physics Practical Skills Part 2.
At Matrix, our specialised HSC Physics teachers can provide personalised guidance, to help boost your marks and confidence!
© Matrix Education and www.matrix.edu.au, 2025. Unauthorised use and/or duplication of this material without express and written permission from this site’s author and/or owner is strictly prohibited. Excerpts and links may be used, provided that full and clear credit is given to Matrix Education and www.matrix.edu.au with appropriate and specific direction to the original content.