Welcome to Matrix Education
To ensure we are showing you the most relevant content, please select your location below.
Select a year to see courses
Select a year to see available courses
Got to document an experiment but don't know how? In this post, we'll guide you step-by-step through how to write a scientific report and provide you with an example.

Join 75,893 students who already have a head start.
"*" indicates required fields

Join 8000+ students each term who already have a head start on their school academic journey.
Is your teacher expecting you to write an experimental report for every class experiment? Are you still unsure about how to write a scientific report properly? Don’t fear! We’ll guide you through all parts of a scientific report, step-by-step.
A scientific report documents all aspects of an experimental investigation. This includes:
Scientific reports allow their readers to understand the experiment without doing it themselves. These reports also give others the opportunity to check the methodology of the experiment to ensure the validity of the results.
Write perfect science reports with this expert-made template! 
Download your free experimental report template
A scientific report is written in several stages. We write the introduction, aim, and hypothesis before performing the experiment, record the results during the experiment, and complete the discussion and conclusions after the experiment.
But, before we delve deeper into how to write a scientific report, we need to have a science experiment to write about! Choose an experiment to use as an example from our 7 Simple Experiments You Can Do At Home article.

Learning how to write a scientific report is different from writing English essays or speeches.
You have to use:
Now that you know the general rules on how to write scientific reports, let’s look at the conventions for their structure!
The title should simply introduce what your experiment is about.
The Role of Light in Photosynthesis
Write a paragraph that gives your readers background information to understand your experiment.
This includes explaining scientific theories, processes, and other related knowledge.
Photosynthesis is a vital process for life. It occurs when plants intake carbon dioxide, water, and light, and results in the production of glucose and water. The light required for photosynthesis is absorbed by chlorophyll, the green pigment of plants, which is contained in the chloroplasts.
The glucose produced through photosynthesis is stored as starch, which is used as an energy source for the plant and its consumers.
The presence of starch in the leaves of a plant indicates that photosynthesis has occurred.

The aim tells us what is going to be tested in the experiment. This should be short, concise, and clear.
The aim of the experiment is to test whether light is required for photosynthesis to occur.
The hypothesis is what you predict the outcome of the experiment will be. You have to use background information to make an educated prediction.
It is predicted that photosynthesis will occur only in leaves that are exposed to light and not in leaves that are not exposed to light. This will be indicated by the presence or absence of starch in the leaves.
Identify the hazards related to the experiment and explain how you would prevent or minimise the risks. A hazard is something that can cause harm, and a risk is how likely it is that harm will occur because of the hazard.
A table is an excellent way to present your risk assessment.
Remember, you have to specify the type of harm that can occur because of the hazard. It’s not enough to simply identify the hazard.
| Hazard and associated harm | Risk | Precautions |
| Scissors are sharp and can cause injury | Low | Use the scissors correctly and store them after use. Wear closed, durable shoes to prevent injury from falling sharp instruments. |
| Methylated spirits are highly flammable and can cause burns or fires. | Low | Before using methylated spirits, ensure that all ignition sources such as Bunsen burners and matches are extinguished. Minimise the volume of methylated spirits used. |

The method has 3 parts:
Let’s break down what you need to do for each section.
This must list every piece of equipment and material used in the experiment.
Remember, you need to specify the amount of each material you used.
As a rule of thumb, you should write the method clearly and in a way that readers can repeat the experiment and get similar results.
Using a numbered list for the steps of your experimental procedure is much clearer than writing a whole paragraph of text. The steps should:
You also need to use past tense and passive voice when you’re writing your method. Scientific reports are supposed to show the readers what you did in the experiment, not what you will do.
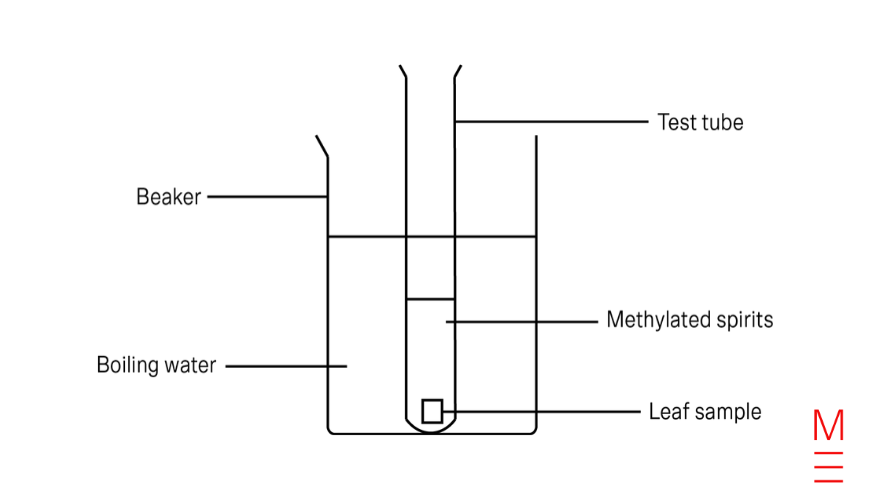
After you complete your steps, it’s time to draw your scientific diagrams! Here are some rules for drawing scientific diagrams:
This is where you document the results of your experiment. The data that you record for your experiment will generally be qualitative and/or quantitative.
Qualitative data is data that relates to qualities and is based on observations (qualitative – quality). This type of data is descriptive and is recorded in words. For example, the colour changed from green to orange, or the liquid became hot.
Quantitative data refers to numerical data (quantitative – quantity). This type of data is recorded using numbers and is either measured or counted. For example, the plant grew 5.2 cm, or there were 5 frogs.
The way you record your results is important. Most of the time, a table is the best way to do this.
Here are some rules to using tables
Note: If your results require calculations, clearly write each step.
Observations of the effects of light on the amount of starch in plant leaves.
| Observations (colour) | Presence of starch (yes/no) | |
| Uncovered leaf (exposed to light) | Dark blue, purple and black | Yes |
| Covered leaf (not exposed to light) | Light-yellow | No |

If quantitative data was recorded, the data is often also plotted on a graph.
The discussion is where you analyse and interpret your results, and identify any experimental errors or possible areas of improvements.
You should divide your discussion as follows.
1. Trend in the results
Describe the ‘trend’ in your results. That is, the relationship you observed between your independent and dependent variables.
The independent variable is the variable that you’re changing in the experiment. In this experiment, it’s the amount of light that the leaves are exposed to.
The dependent variable is the variable that you’re measuring in the experiment. In this experiment, it’s the presence of starch in the leaves.
Example:
The presence of starch is indicated when the addition of iodine causes the leaf to turn dark purple. The results show that starch was present in the leaves that were exposed to light, while the leaves that were not exposed to light did not contain starch.
2. Scientific explanation
Give an explanation of the results using scientific knowledge, theories, and any other scientific resources you find.
Example:
As starch is produced during photosynthesis, these results show that light plays a key role in photosynthesis.
3. Validity
Validity refers to whether or not your results are valid. This can be done by examining your variables.
VAlidity = VAriables
Identify the independent, dependent, controlled variables, and the control experiment (if you have one).
The controlled variables are the variables that you keep the same across all tests e.g. the size of the leaf sample.
The control experiment is where you don’t apply an independent variable. It is untouched for the whole experiment.
Ensure that you never change more than one variable at a time!
Example:
The independent variable of the experiment was the amount of light that the leaves were exposed to (the covered and uncovered geranium leaf), while the dependent variable was the presence of starch. The controlled variables were the size of the leaf sample, the duration of the experiment, the amount of time the solutions were heated, and the amount of iodine solution used.
4. Reliability
Identify how you ensured the reliability of the results.
REliability = REpetition
Show that you repeated your experiments, cross-checked your results with other groups, or collated your results with the class.
Example:
The reliability of the results was ensured by repeating the experiment 5 times and comparing results with other groups. Since other groups obtained comparable results, the results are reliable.
5. Accuracy
You should discuss accuracy if your results are in the form of quantitative data (numerical), and there is an accepted value for the result.
Accuracy wouldn’t be discussed for our photosynthesis experiment as qualitative data was collected. But, it would be discussed if we were measuring gravity using a pendulum:
The measured value of gravity was 9.8 m/s2, which is in agreement with the accepted value of 9.8 m/s2.
6. Possible improvements
Point out any errors or risks you found in the experiment and suggest a method to improve it.
If there are none, then suggest new ways to improve the experimental design, and/or minimise error and risks.

Example:
Possible improvements could be made by including control experiments. For example, testing whether the iodine solution turns dark purple when added to water or methylated spirits. This would help to ensure that the purple colour observed in the experiments is due to the presence of starch in the leaves rather than impurities.
State whether the aim was achieved and if your hypothesis was supported.
Example:
The aim of the investigation was achieved, and it was found that light is required for photosynthesis to occur. This was evidenced by the presence of starch in leaves that had been exposed to light, and the absence of starch in leaves that had been unexposed. These results support the proposed hypothesis.
Written by Matrix Science Team
The Matrix Science Team are teachers and tutors with a passion for Science, across Biology, Chemistry and Physics, and a dedication to seeing Matrix Students achieving their academic goals.© Matrix Education and www.matrix.edu.au, 2025. Unauthorised use and/or duplication of this material without express and written permission from this site’s author and/or owner is strictly prohibited. Excerpts and links may be used, provided that full and clear credit is given to Matrix Education and www.matrix.edu.au with appropriate and specific direction to the original content.