Welcome to Matrix Education
To ensure we are showing you the most relevant content, please select your location below.
Select a year to see courses
Learn online or on-campus during the term or school holidays
Learn online or on-campus during the term or school holidays
Learn online or on-campus during the term or school holidays
Learn online or on-campus during the term or school holidays
Learn online or on-campus during the term or school holidays
Learn online or on-campus during the term or school holidays
Learn online or on-campus during the term or school holidays
Get HSC Trial exam ready in just a week
Get HSC exam ready in just a week
Select a year to see available courses
Science guides to help you get ahead
Science guides to help you get ahead

How is ATAR calculated? Let’s see!
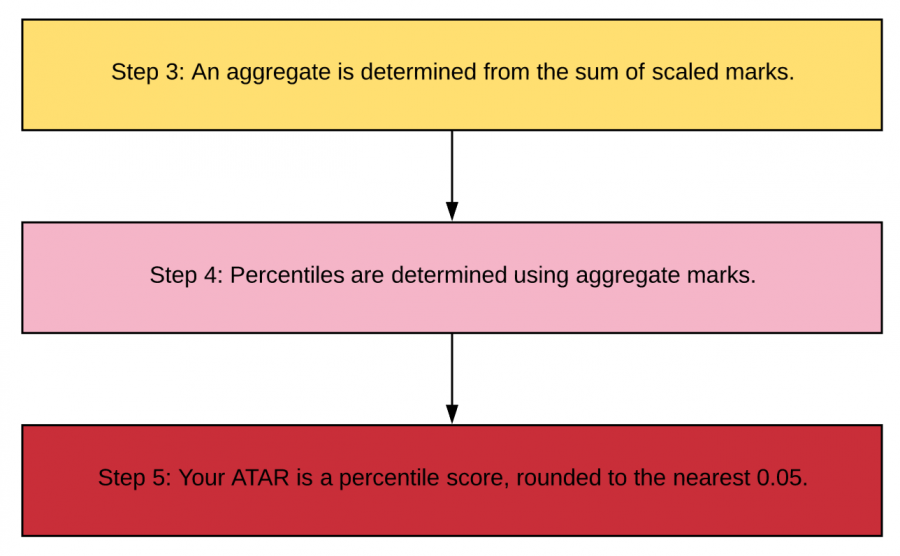
The final step in calculating your ATAR is converting your scaled marks into an aggregate and percentile. The percentile rounded to the nearest 0.05 is your ATAR.
Once UAC completes the scaling of your HSC marks, they will use your scaled marks to determine the aggregate. You can see the scaling of different HSC courses in Part 2: Scaling of HSC Marks of this guide.

The aggregate is the sum of scaled marks in 10 units of ATAR courses.
The calculation of the aggregate will make more sense if we look at the example below. Let’s look at the step-by-step process of calculating an ATAR.
Example
Consider a student with the following ATAR courses shown in the table below.
| Table: Aggregate of Scaled Marks | |||
| Subject | Units | HSC Mark | Scaled Mark |
| English Advanced | 2 | 86 | 74 |
| Mathematics Advanced | 2 | 94 | 86 |
| Business Studies | 2 | 88 | 76 |
| Chemistry | 2 | 90 | 88 |
| Modern History | 2 | 89 | 80 |
| History Extension 1 | 1 | 46 | 42 |
| Aggregate | 397/500 | ||
Based on the rule of determining the aggregate:
Percentiles indicate the ranking of students in relation to other ATAR-eligible students and are determined on the basis of the aggregate of scaled marks. The percentile corresponding to a particular aggregate is the percentage of the ATAR cohort who received an aggregate mark less than or equal to that aggregate.
The final step is to determine what the percentiles would have been if all students in their Year 7 cohort completed Year 12 and were eligible for an ATAR. These percentiles are rounded to the nearest 0.05. These are your ATARs.
The table below shows the ATAR at various percentiles for the 2014 through to 2016 cohorts.
| Table: ATAR percentiles, 2014 – 2016 (Source: 2016 Scaling Report by UAC) | |||
| Percentile | ATAR 2016 | ATAR 2015 | ATAR 2014 |
| 100 | 99.95 | 99.95 | 99.95 |
| 99 | 99.40 | 99.40 | 99.35 |
| 98 | 98.75 | 98.75 | 98.75 |
| 95 | 96.95 | 96.95 | 96.95 |
| 90 | 93.95 | 93.95 | 93.95 |
| 85 | 90.90 | 90.90 | 90.90 |
| 80 | 87.85 | 87.85 | 87.85 |
| 75 | 84.75 | 84.75 | 84.80 |
| 70 | 81.60 | 81.65 | 81.70 |
The table below shows the lowest aggregate of scaled marks corresponding to each of the selected ATARs.
| Table: ATAR percentiles, 2014 – 2016 (Source: 2016 Scaling Report by UAC) | |||
| ATAR | Lowest aggregate | ||
| 2016 | 2015 | 2014 | |
| 99.95 | 476.6 | 478.1 | 475.3 |
| 99.50 | 455.8 | 457.9 | 454.0 |
| 99.00 | 446.0 | 446.9 | 444.5 |
| 98.00 | 431.2 | 432.4 | 431.2 |
| 95.00 | 403.8 | 404.2 | 404.4 |
| 90.00 | 371.7 | 371.2 | 372.2 |
| 85.00 | 345.3 | 343.8 | 345.1 |
| 80.00 | 320.6 | 319.9 | 320.6 |
| 75.00 | 297.5 | 297.0 | 296.9 |
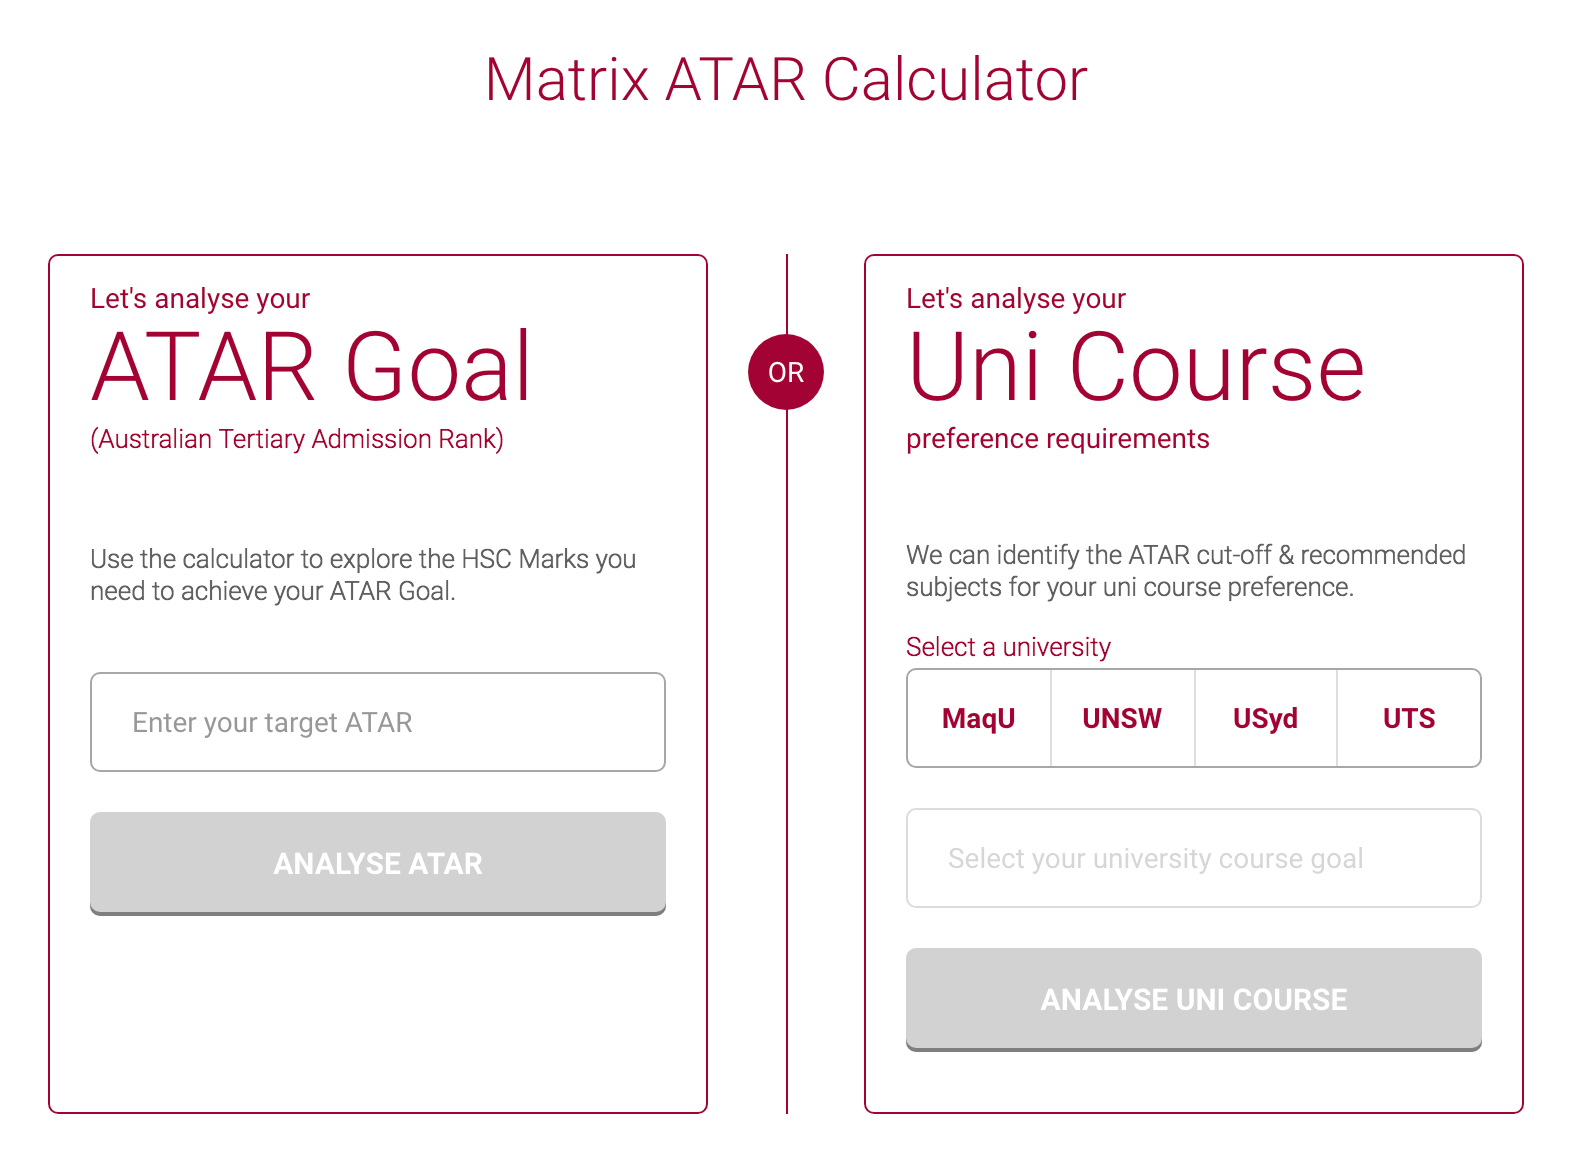
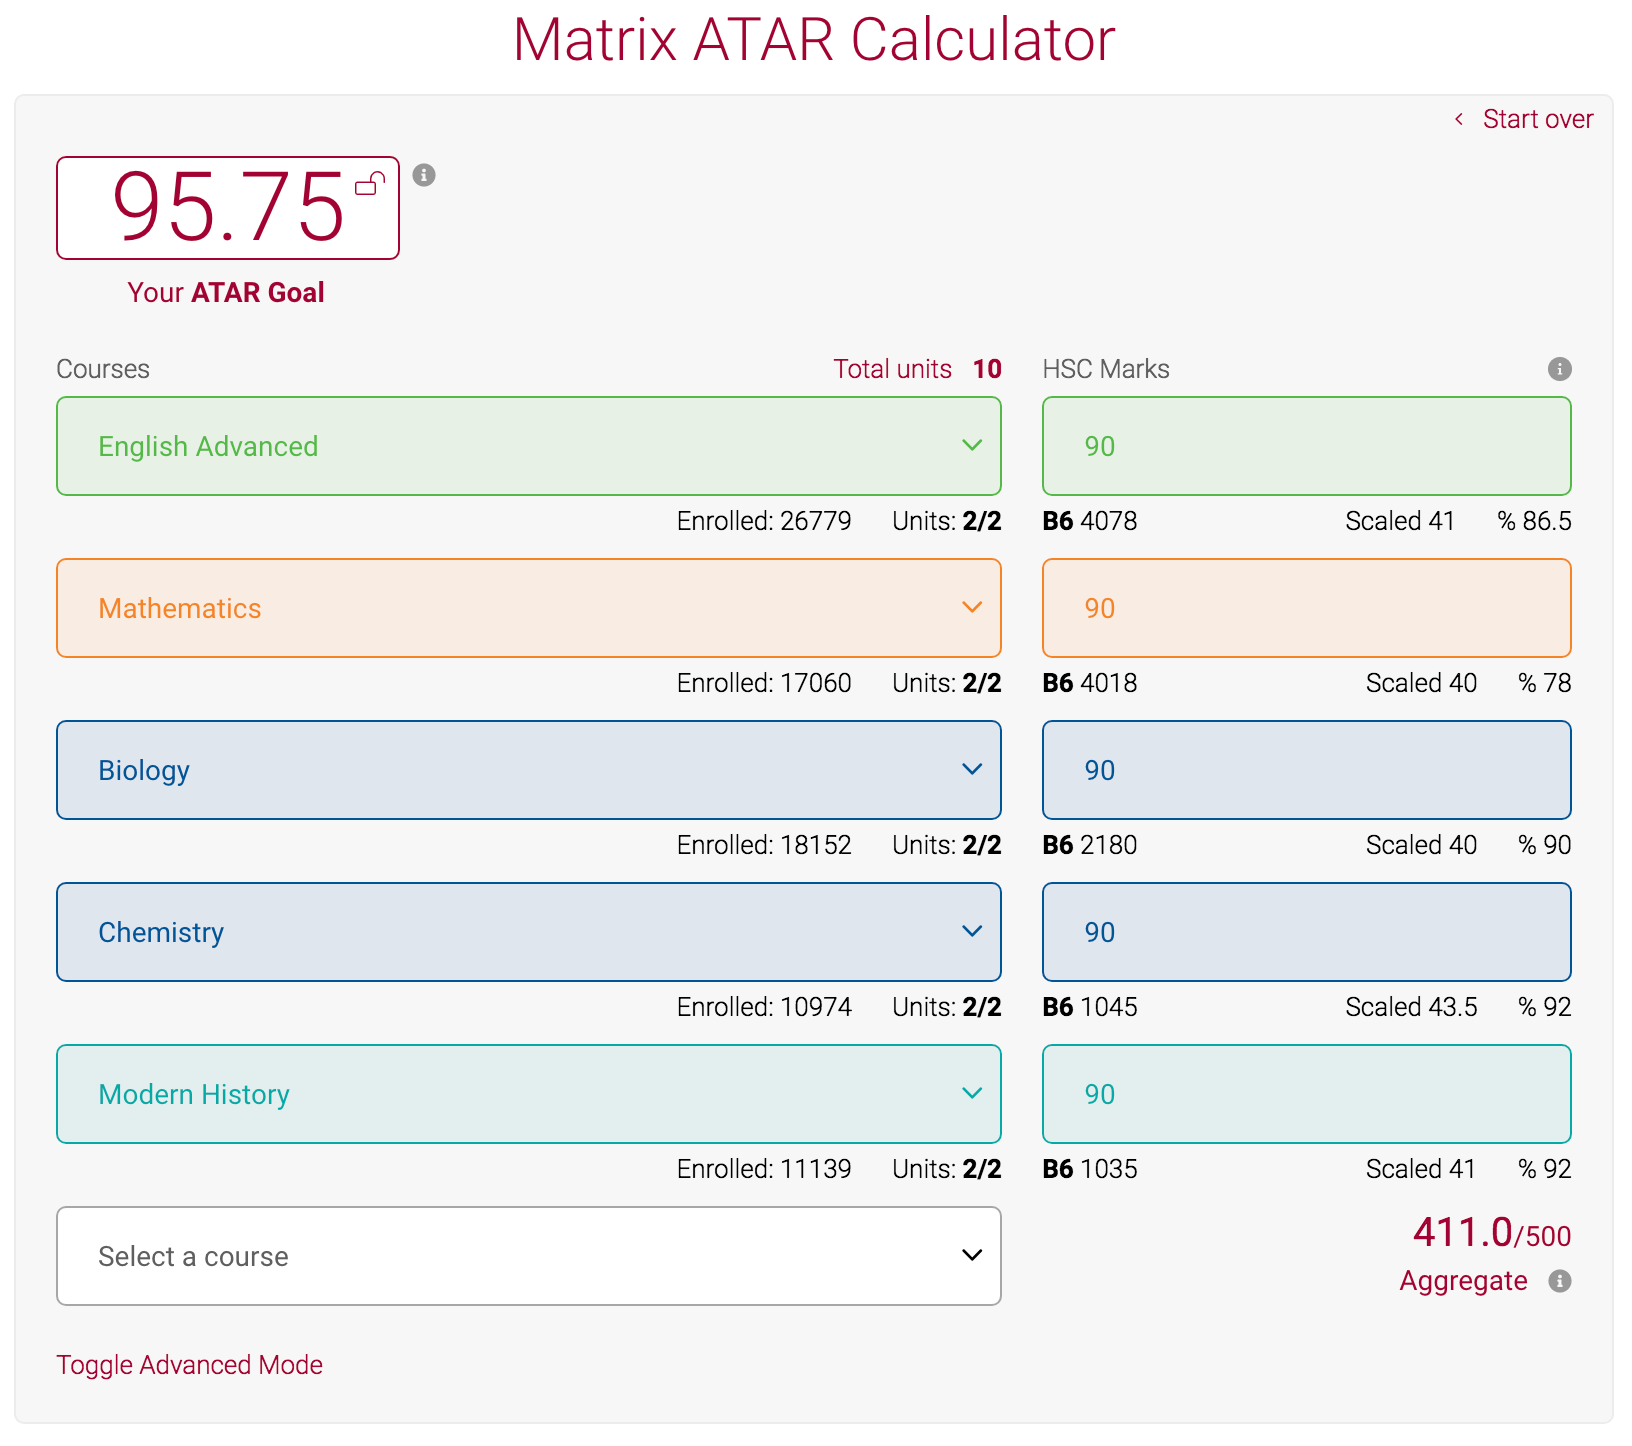
You can estimate your ATAR using HSC marks with the Matrix ATAR calculator. It can also identify the ATAR cut-off for your university course preference.

Below is an example of an ATAR calculation with a HSC mark of 90. The Matrix ATAR Calculator also provide useful additional information such as:

© Matrix Education and www.matrix.edu.au, 2025. Unauthorised use and/or duplication of this material without express and written permission from this site’s author and/or owner is strictly prohibited. Excerpts and links may be used, provided that full and clear credit is given to Matrix Education and www.matrix.edu.au with appropriate and specific direction to the original content.